 f y m
For entertainment purposes only. Not a recommendation to buy. The author is not currently trading and will not be taking a position in this stock unless otherwise noted.
f y m
For entertainment purposes only. Not a recommendation to buy. The author is not currently trading and will not be taking a position in this stock unless otherwise noted.
Based on this chart I say APRI could produce a good day trade any day. It's possible that a particularly telling pattern will develop on the daily chart in the coming days, signalling a rally the next day, or that there will be a strong open one day, followed by a clear intraday buying pattern and a strong move through the rest of the day. A single day rally from the current price area to 6 is a possibility. An event of that sort would suggest the possibility of a continuation to 16 in very short order.
Seriously? Wait, it has to pause, somehow, at 2, and it has to pause, somehow, at, well, 6, or between 5 and 6 ... and, can it really go lickety split to 16? It even seems early, not completely developed. These are just dreams, I know, and, what's more, bad shit can happen, reverse splits, bankruptcy, the below noted gap down. Buy two positions, plan to sell one at 2, the second at 6, or 5, the third at 16? Whatever, make them small positions. Taking a look at the fundamentals, they sell a bit of something, but, of course, are losing money hand over fist, and they don't even have a lot of cash. Something makes me like this company, and maybe you, too, are a believer. More below. Maybe what I would do is take a small position and hold for ... 30, really. A one day rally to 2 would also suggest the possibility of a continuation of that advance. Multi day rallies to 2 or 6 would suggest the possibility of a multi day retracement of those rallies, especially if they ended in extended bars.
Given that we are considering the possibility of a move of more than 100%, possibly considerably more, a very small position with no stop might be worth considering.
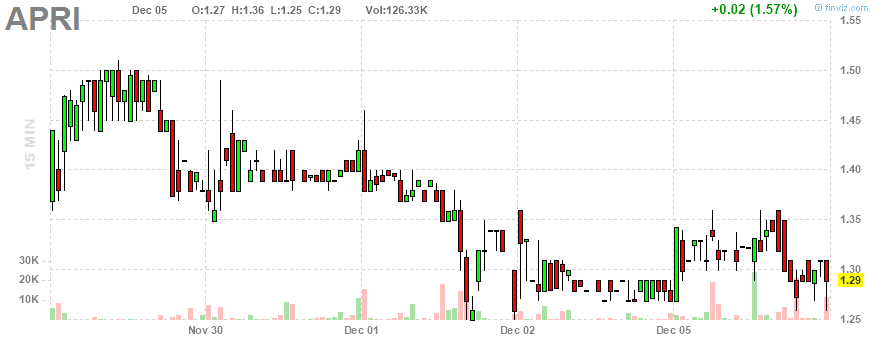
For trading with a stop, the present pattern on the five day chart has merit. It cannot be regarded as an especially high percentage bet, but a price of 1.26 tomorrow is a possibility, and an in the market stop at 1.24 might hold, if you're doing that kind of trading. Keep in mind that a gap down is possible. If you take this trade, you should regard the risk as being 50%, so a limited position is advised in any case.
get your sweetie something

I love this monthly chart. Ten years of awesomeness. But what do they do that's so great? Oh my effing God, it's an erectile disfunction play. Reason for excitement! Based on this chart, it goes to 16, takes some kind of break, goes to 30, takes a break, goes to 60, takes a (bigger break), then goes to 120 ... and tops out.
$APRI Looks like it will breakout
— AKS (@AbhS) Dec. 5 at 11:35 AM
$APRI Conf on Thursday.Pr before that?
— AKS (@AbhS) Dec. 5 at 08:54 AM
$APRI going to Zero!!
— Trader (@BuyValueSellGreed) Dec. 4 at 10:17 AM
$APRI Folks, the market has spoken. Delisting soon, either via PPS or market cap deficiency. Regardless, this appears to be a scam.
— Jason (@Jason017) Dec. 2 at 02:33 PM
$APRI They are actively discussing with a potential partner as per Pascoe.Listen to the audio from last Investor conference
— AKS (@AbhS) Dec. 2 at 10:39 AM
$APRI Oversold.Conference next week.Watchers will be left watching.Buy as much as u can
— AKS (@AbhS) Dec. 2 at 08:16 AM